
| Home |
| About |
| Products |
| Contact |
| Request Information |
| QC Pak Software |
| Links |
 |
Absorbance QC Pak
Microplates (also called “microtitre,” “microtiter ®,” or “micro titration” plates) provide a rapid way to analyze large numbers of tests. Samples are typically on the order of a few hundred µL, and a large number of plates can be measured in a short period of time. A 96 well plate is commonly used for these analyses, however 12, 24, 48, 384, and 1536 well plates are also available.
A broad variety of analytical measurements can be performed in microplates including absorbance (OD), luminescence (L), fluorescence intensity (F), time-resolved fluorescence (TRF), and fluorescence polarization (FP). In each case, the fundamental measurement is the same as when a standard cuvette is used, but the instrument (called a “reader”) is capable of reading the entire plate is less than a minute and generate a complete report.
While the general design of a reader is identical to that of a cuvette system (e.g. an absorbance reader is similar in nature to a spectrometer), the optics are configured such that 96 samples can be read on a plate with an 8 x 12 format.
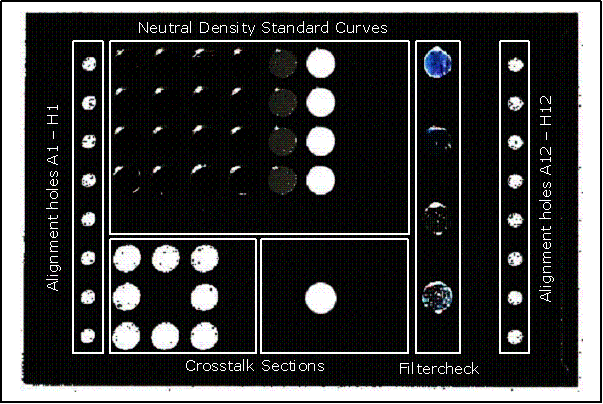
A QC Pak™ consists of a plate with a number of compounds to evaluate the performance of the reader, and an Excel template that calculates a variety of parameters such as linearity, crosstalk between wells, and alignment of the plate in the reader. A report is automatically generated which can be printed and/or archived.
This manual describes the use of ABS QC Pak for filter and monochromator-based microplate readers.
The minimum computer requirements for QC Pak are:
Microsoft Windows 2000
Intel Pentium III 500 MHz
128 MB RAM
100 MB Free Hard Disk
Excel 97
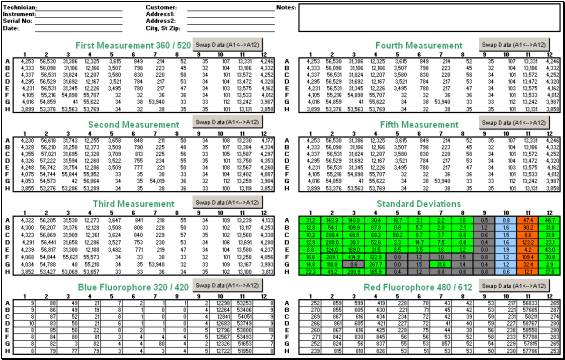
Figure 1: Raw Data Sheet
The analytical data can be viewed by selecting the tabs on the bottom of the spreadsheet:

The X-Talk and Alignment Tab presents:
- Averaged Data
The averages of the five measure-ments with 405nm, as well as the results of the alignment of the microplate transport. The gray cells indicate the background, which is from empty cells on the plate.

Figure 2: Averaged Data
- Microplate Alignment Plot
The Microplate Alignment Plot (Figure 3) presents the ansorbance readings for Column 1 and Column 12 for rows 1 - 8.
The cells in column 1 and column 12 of the plate are the same, and the two lines will coincide if the tray is properly aligned.
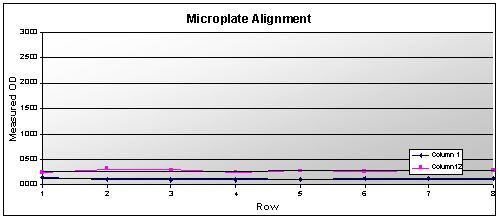
Figure 3: Microplate Alignment Plot
- Alignment and X-talk Data & Results
The Alignment and Cross-Talk Results
(Figure 4) describe the statistical analysis of the data and presents the results for the Alignment and Cross Talk tests.
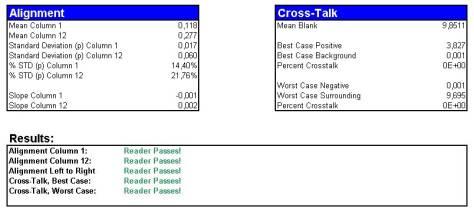
Figure 4: Alignment and Cross-Talk Data and Results
- The acceptance criteria are:
- Alignment Column 1 – slope is less than 5 %
- Alignment Column 2 – slope is less than 5%
- Alignment Left to Right – the average 1 & 2 within 20%
- Crosstalk, Best Case – less than 3 x 10 -5
- Crosstalk, Worst Case – less than 1 x 10 -2
The Linearity Tab presents:
Averaged Data
same as in “ X-Talk and Alignment Tab”
Linearity Plot
The Linearity Plot (Figure 5) presents the regression line of the averages for each of the 5 readings at 405 nm of the 7 neutral density filters (column 2 – 8, row 1 – 4 each)
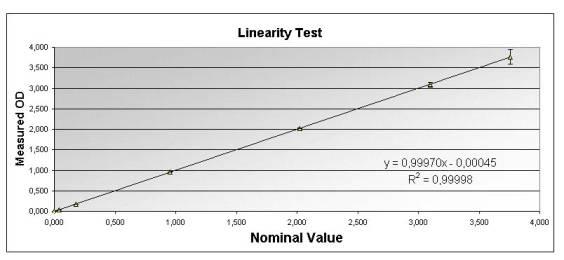
Figure 5: Linearity Plot
Data Region
The Data Region (Figure 6) presents a summary of the analytical data

Figure 6: Data Region
Results Field
The Results field (Figure 7) indicates the results of the various tests.

Figure 7: Results Field
The acceptance criteria are:
- Linearity Relative to Nominal - R 2 should be greater than 0.900
- Same Well Precision (High Concentration) - should be less than 10%
- Same Well Precision (Low Concentration) - should be less than 0.010
- 405: Reading of 405nm QC filter must be lower 1.0
Blocking on other QC filters must be higher 4.0 - 450: Reading of 450nm QC filter must be lower 1.0
Blocking on other QC filters must be higher 4.0 - 492: Reading of 492nm QC filter must be lower 1.0
Blocking on other QC filters must be higher 4.0 - 620: Reading of 620nm QC filter must be lower 1.0
Blocking on other QC filters must be higher 4.0
Copyright 2000 - 2011 Innovative Instruments, Inc. All rights reserved.